|
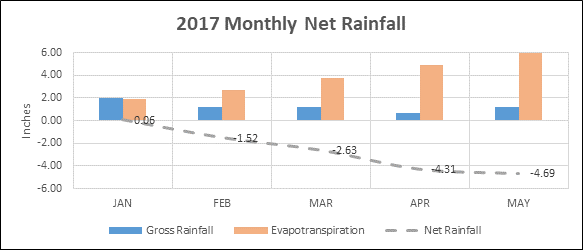
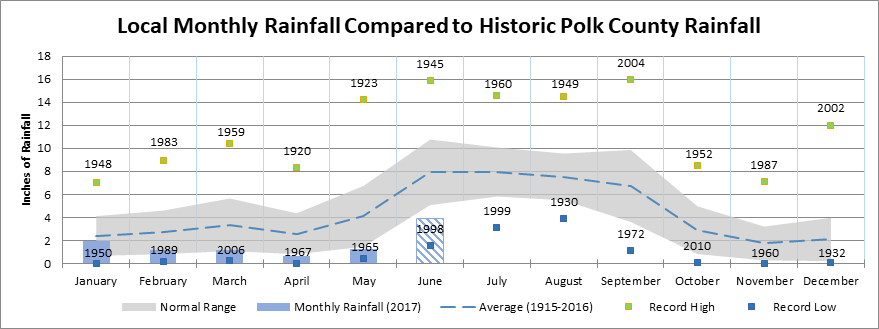
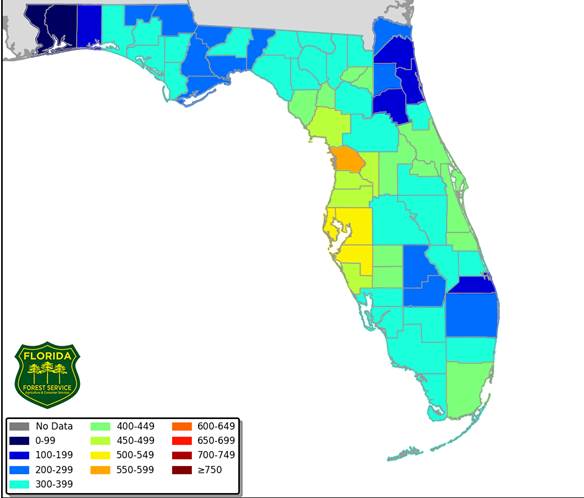
Seems like we are finally getting the rainfall we so desperately needed. Below is some information provided by Devon Moore, our Environmental Scientist on hydrology from the month of May. Keep in mind we didn’t really start getting any rainfall until we entered June, so any significant changes from that will not show up until next month’s update, something to look forward too! Rainfall:During the month of May, the Winter Haven area accumulated 1.25 inches of rainfall, averaged from several local sources. However, this volume of gross rainfall was offset by an even greater amount of evapotranspiration; netting a deficit of 4.69 inches of water from the area. Evapotranspiration, which is the loss of liquid water from the earth due to evaporation and plant use (transpiration), can cause water loss if its value is greater than that of rainfall. Figure 1 displays the 2017 monthly rainfall data collected to date. Following the slope of the net rainfall curve (dashed line) we can see that the rate of water loss is beginning to slow down, which is promising. Figure 1: Comparing May’s precipitation data with historic records in Figure 2, we can see that rainfall is still well below average and outside of the normal range. Our prospects for more rain have already yielded some promising results. Preliminary reports indicate that we have received close to 4 inches of rain within the first few days of June (shown as striped bar). If this trend continues, drought conditions may turn around sooner rather than later. Figure 2: Lake Levels:The lakes of the Winter Haven area are strictly rainfall driven—there are no streams or rivers that flow into Winter Haven’s lakes. Therefore, rainfall is one of the most significant factors influencing the level of our lakes. Figure 3 shows the current trend in surface level for the Southern Chain of Lakes. Even with the minimal rainfall during the first 5 months of 2017, surface level has just dropped below the 30-year average this month; yet it’s still within the normal range. We’d like to note, however, that this long-term average may be skewed on the low side due to considerable drought conditions within the last 20 years. In fact, all of the monthly minimum levels have occurred since the year 2000. Looking forward, the significant rain we have received in the first days of June should help to prevent further loss in lake level and may even increase surface levels if current trends persist. Figure 3: Fire Consideration:One of the most important threats to be aware of during dry times is the risk of wild fire. The Florida Forest Service updates their webpage with the daily KBDI for each Florida county. The Keetch-Byram Drought Index (KBDI) is used to measure the potential for fire using soil dryness estimates. The index scales from 0 – 750; with 750 being the driest and highest risk for forest fires. Figure 4 shows an example of a KBDI map for June 4th, 2017. The KBDI score for Polk county on May 31st, 2017 was 590. This index score was reduced to an astonishing 361—a promotion of 4 ranks on the scale in just 4 days! This significant improvement should hopefully continue as we receive more rain. Figure 4: In summary, the hydrology of the Winter Haven area shows that we are still in drought conditions. Rainfall and surface level values for the month of May were considerably low and the KBD Index showed a fairly moderate risk of forest fire for Polk County. However, recent rainfall data shows significant improvement in all categories. If anyone has any questions or concerns, please don’t hesitate to contact the Winter Haven Natural Resources Division. We will be happy to provide additional information whenever it is needed.
0 Comments
Your comment will be posted after it is approved.
Leave a Reply. |
Upcoming Events |
|


